Figure 1
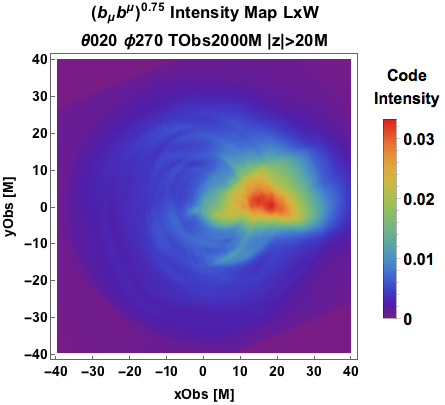
A powerful jet viewed 20° from the jet axis generated from an emissivity function in which the gas pressure is constant along the jet.
Figure 2
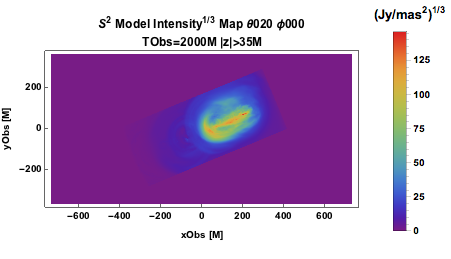
A limb-brightened intensity map in which particle emission is varies quadratically with velocity shear.
Figure 3
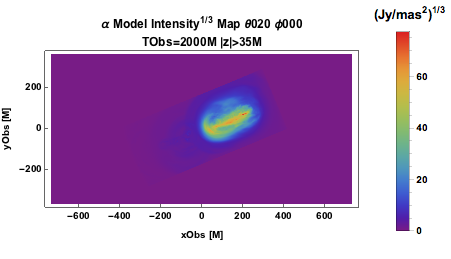
Intensity map generated from a synchrotron emissivity prescription in which the gas pressure is proportional to the efficiency of linear momentum transport (inspired by the disk α-model of Shakura and Sunyaev 1973) and minimum of the cooling and radiative timescales