Sgr A* Spectral Modeling
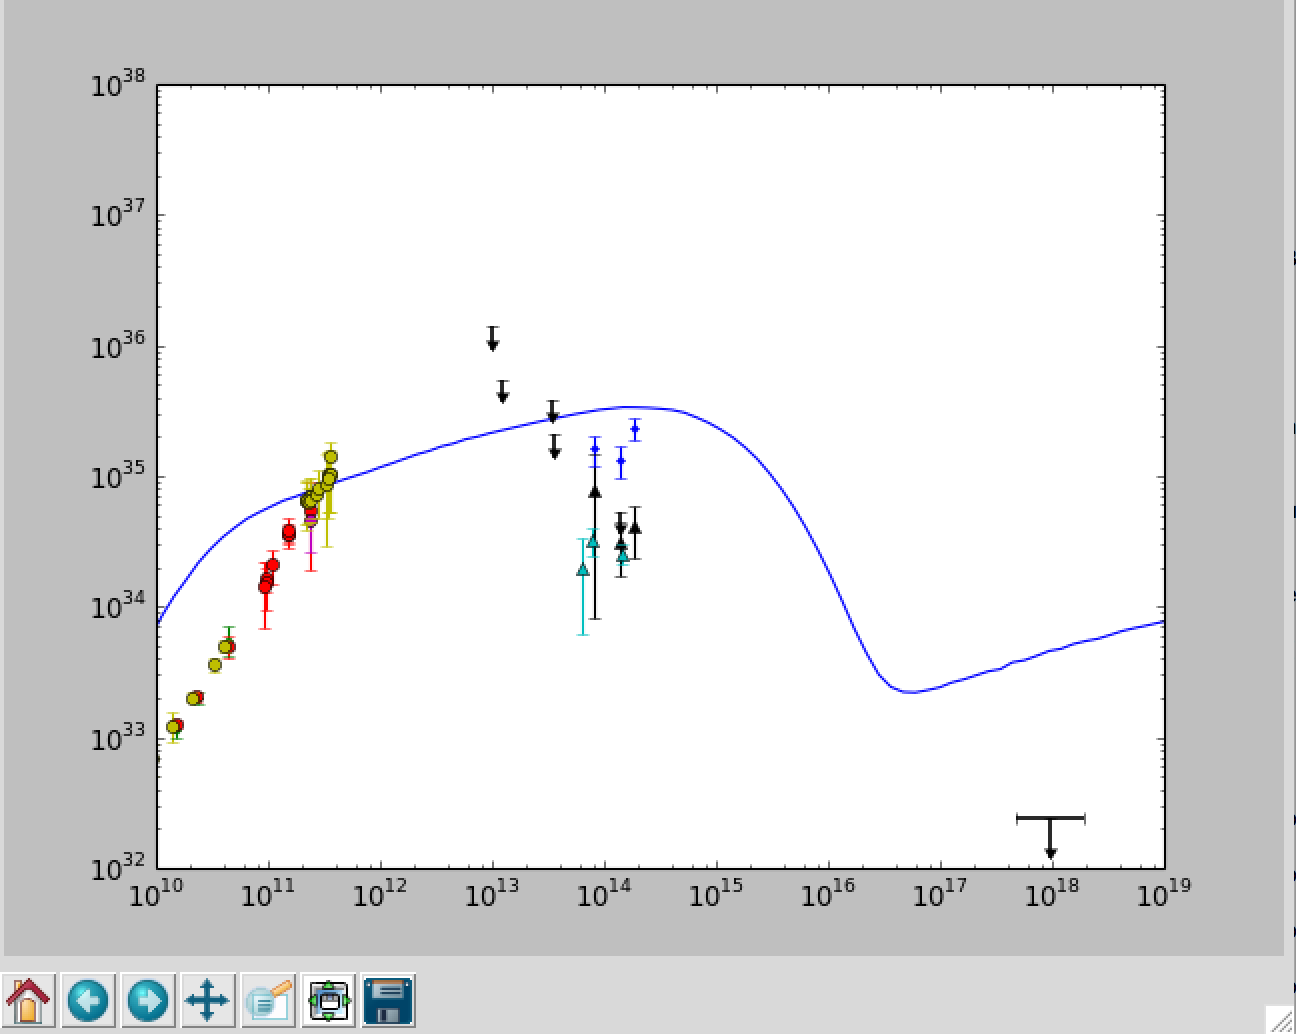
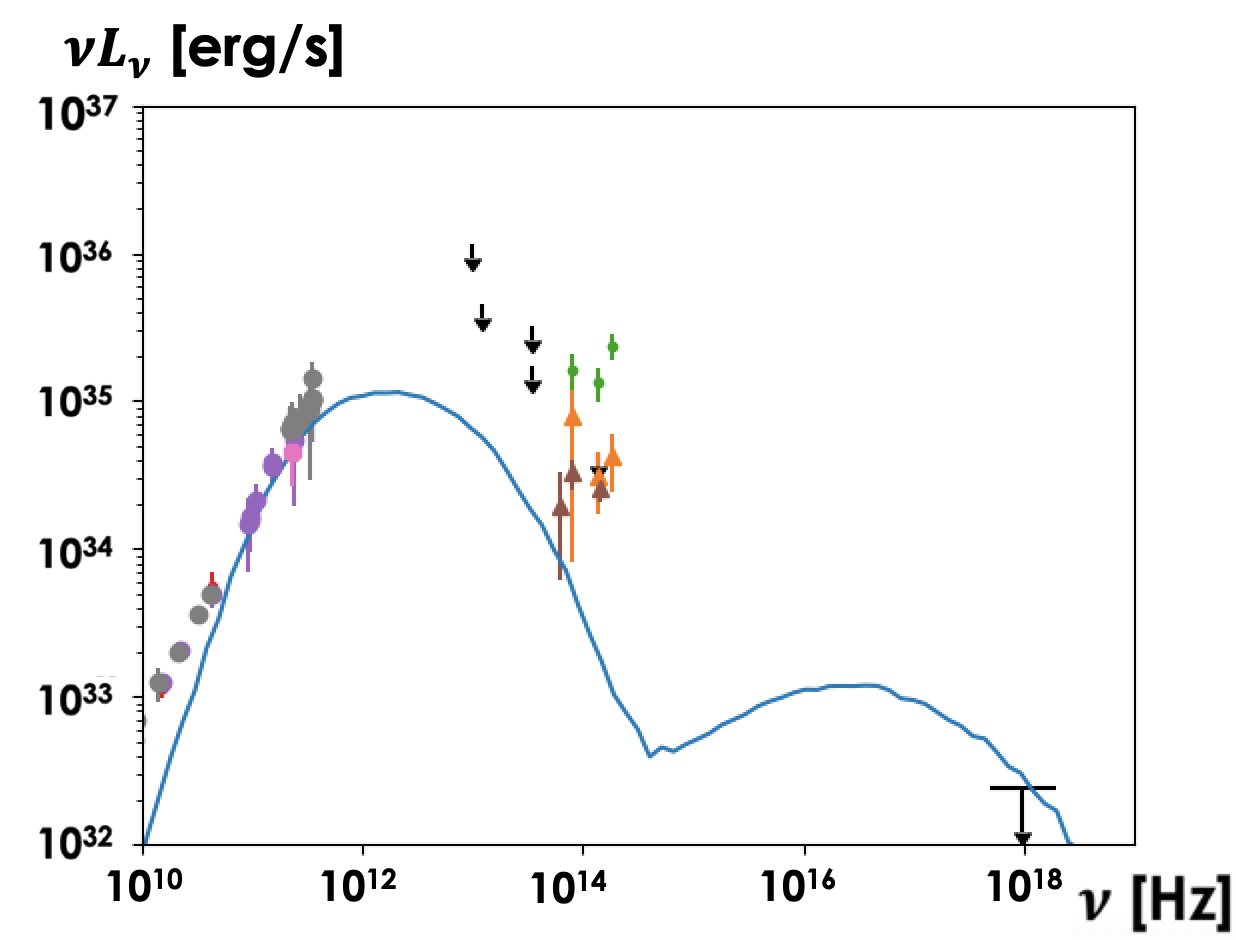
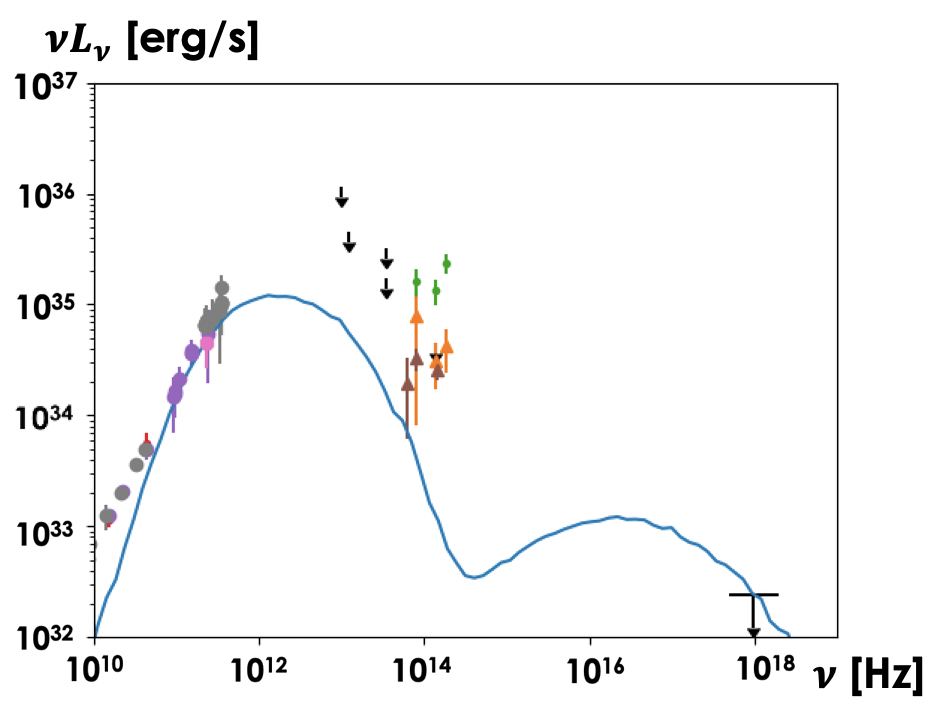
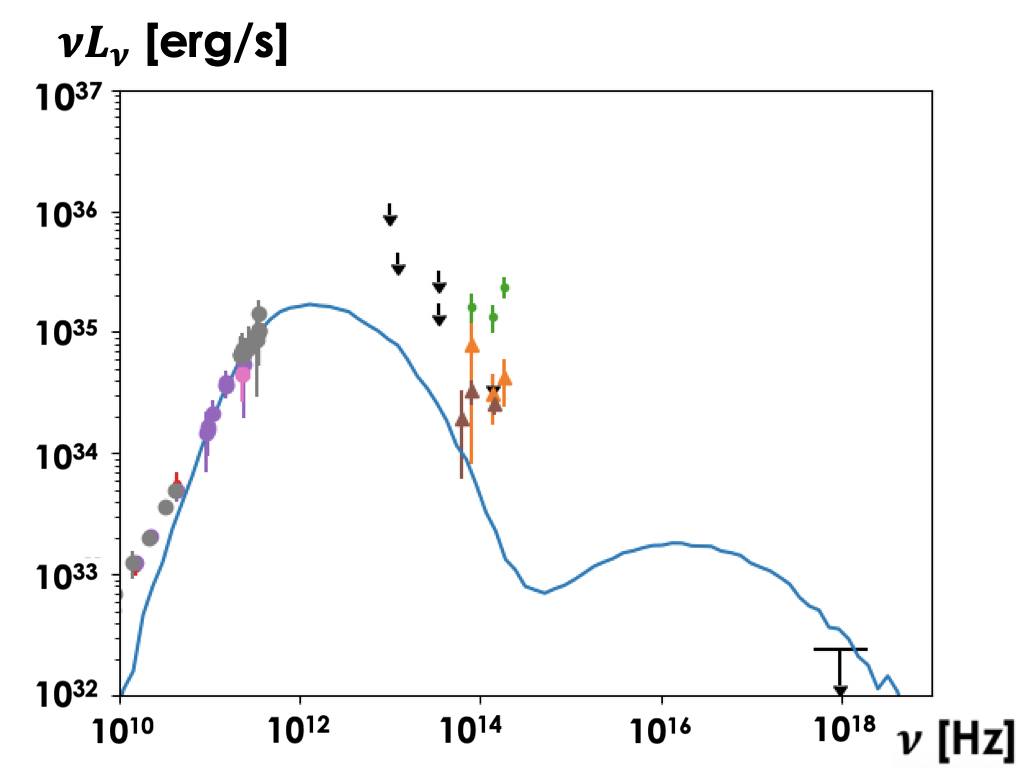
The spectra below are computed with the multi-wavelength Monte Carlo ray-tracing code GRMONTY (Dolence et al., 2009). The models in Figs. 1-3 emulate Sgr A* data (points with error bars) from ν = 1010 Hz microwaves to 1019 Hz
- Electron temperature (fe ,βc) models have steeper-than-observed spectrum, likely corona-dominated
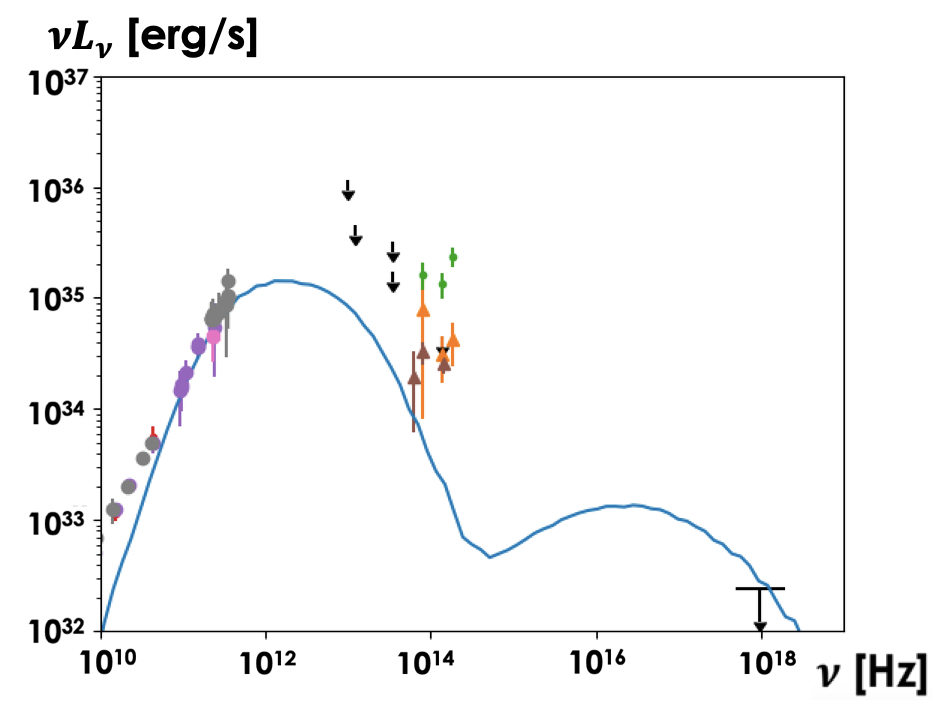
- Beta models have flatter-than-observed spectra near sub mm-bump, but similar slopes to observed spectrum after
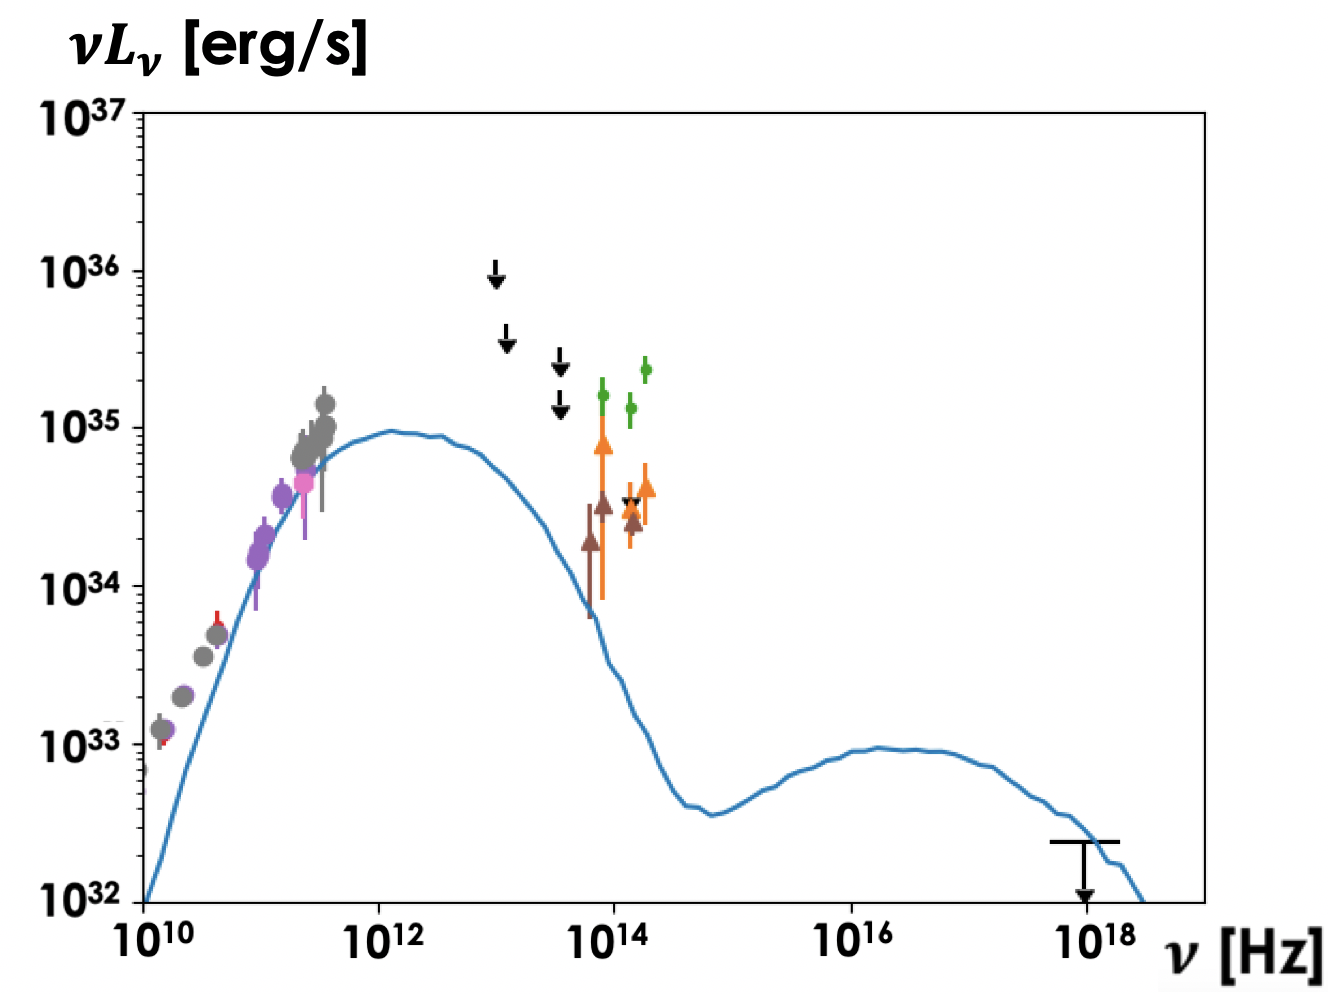
- Bias model spectra are slightly flatter-than-observed and overproduce the high frequency end
Figure 1
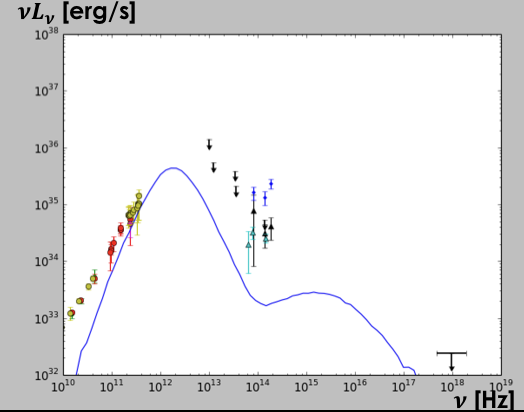
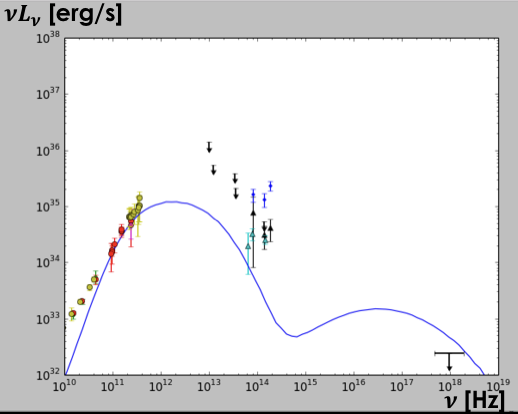
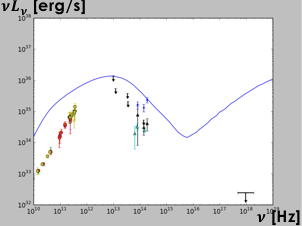
Spectra (νLν vs. ν) for constant electron heating fraction with critical beta model (fe,βc) = (0.1,1) (left) and (0.5,1) (right) from 1010 Hz microwaves to 1019 Hz
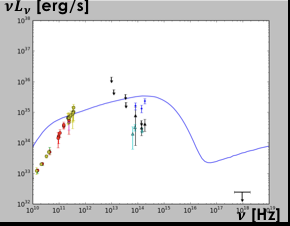
Figure 2
Beta model spectra from 1010 Hz microwaves to 1019 Hz x-rays for β = 0.01 (left), 0.1 (middle) and 1 (right).
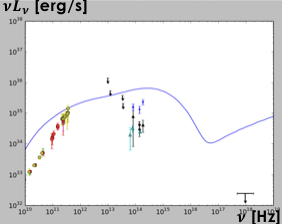
Figure 3
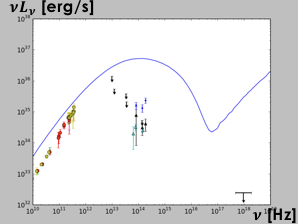
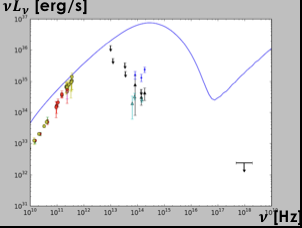
Bias model spectra from 1010 Hz microwaves to 1019 Hz x-rays for N = 0 (left), 2 (middle) and 4 (right).
The temporal evolution of spectra for the model (fe ,βc)=(0.5,1) is shown below for a few simulation times.
Figure 4
T=10,000M T=10,010M T=10,100M T=11,000M
a.) Spectra for the model (fe ,βc)=(0.5,1) at logarithmically spaced timesteps T=10,000M, 10,010M, 10,100M and 11,000M
T=9,000M T=10,000M T=11,000M
b.) Spectra for the model (fe ,βc)=(0.5,1) at linearly spaced timesteps T=9,000M, 10,000M and 11,000M